
If your organization builds large reports in Microsoft Power BI, or if you’re crying out for a solution that will help you get a handle on your data (and how to visualize it) in a succinct and efficient manner, you need to understand and create paginated reports in Power BI. Today, we’ll go into what they are and some of the key benefits.
What is a paginated report?
First things first, what is a paginated report? Well, a lot of the answer is in the name. Paginated as in “turned into pages”. A paginated report in Power BI is formatted in a specific way so that the right amount of information “fits” on a single page. It’s designed to be printed or shared digitally (via PDF, for example) in an easily consumable way. It will display all the data of a report in a table that is turned into pages.
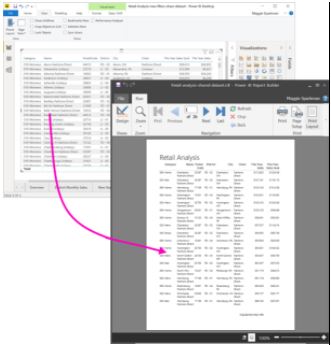
Create a paginated report with a Power BI shared dataset – Power BI Report Builder – Power BI | Microsoft Docs
One reason why paginated reports are useful is the ability to print or share all the data in a report, no matter how long, in a standard format that your readers can flick through (i.e. pages) without having to endlessly scroll. They are also designed to be “pixel perfect”. This means that you can control the report page layout and make sure what’s on there is viewable. Basically, you can zoom in and the image will be crystal clear, rather than a pixelated mess.
In a typical Power BI report you may potentially only see some of its rows in the table on the page. You have to scroll down to see the rest. If you print that page, or export it to PDF, the only rows that print are the ones you saw on the page, so you’re dealing with a lack of visibility. Or at least it’s awkward to get that full view.
In a paginated report, when you print or export it to PDF, the report is converted into pages all containing the same amount/volume of information, making it easier to navigate a large report or to print.

Several key benefits of paginated reports
There are plenty of reasons to learn how to build paginated reports in Power BI. Key benefits include:
- Access your report information faster: the whole point of paginating your reports is to be able to see your information clearly and quickly. When you’re dealing with large reports the last thing you want is to have to scroll endlessly through a document or navigate a complicated spreadsheet.
- Connect to any datasets in your Power BI (Premium): the data organizations generate, and store comes from a lot of different sources. Being able to incorporate a wide range of datasets is a crucial aspect of Power BI and makes building reports easier.
- Export to PDF, Word, Excel, and PowerPoint: as mentioned, paginated reports are designed with printing and PDFs in mind. So, any report that you might look to print or turn into a PDF to share could benefit from being paginated. Many organizations use paginated reports in Power BI for operations reports like sales invoices, production records, or account audits.
- It’s free to download and use: if you already use Power BI, you can download Power BI Report Builder for free.
How to create paginated reports in Power BI
Creating a paginated report in Power BI is straightforward. In the Power BI report web portal, select new paginated report. A wizard will help you build the type of report you want, whether that’s a chart, map, table/matrix, or a blank report. You can see a step-by-step guide to creating reports here.
When it comes to building or populating your paginated reports, you can link several data sources to the report builder. There are currently several data sources supported:
- Power BI Premium Datasets
- Azure Analysis Services (via SSO)
- Azure SQL Database and Data Warehouse
- SQL Server Analysis Services via a gateway
- SQL Server via a gateway
- Oracle
- Teradata
Power up your Power BI with Bauen
At Bauen Group, we are Microsoft experts and experienced B2B technology providers who are dedicated to helping our customers get the maximum return on their technology investments. We know that there is a world of possibility and potential in Microsoft Power BI. From paginated pages to customer visualizations, our experts can help you implement, adopt, and use the business intelligence solution, so that you get real results and a better return on investment for your business today.
If you want to find out more about the key benefits of paginated reports in power BI or further insights into any of your Microsoft investments, get in touch with our team today.